Welcome!
-
-
- Learn Home
- Core Concepts
- Companies and Departments
- Courses
- Course Status and Visibility
- Sections
- Video Activities
- Reading Activities
- Document Activities
- Enrolling People in a Course
- Bulk Enroll With CSV
- Roles in a Course
- How Progress Is Tracked
- Course Reports
- Knowledge Base Overview
- Libraries and Folders
- Uploading Content Items
- Library Visibility
- AI Agent per Library
- My Courses
- Platform People
-
- Project Structure Template
- Table of Contents (TOC)
- Content Folder
- Introduction to Markdown
- Markdown Basics
- Markdown Lists
- Markdown Links
- Markdown Images
- Markdown Code
- Markdown Tables
- Markdown Equations
- Markdown Videos
- Markdown Embedded HTML
- VS Code Snippets
- Introduction to Styles
- Framed Narrations
- Markdown Configuration
- Editor Setup
-
Course Reports
TL;DR; The Reports tab shows you how your course is doing at a glance — four summary cards at the top, then three sub-tabs (Overview, Learners, Activity) with progressively more detail. Use it to check cohort health, spot who's falling behind, and pull completion data for stakeholders.
Course reports are where Learn stops being about content and starts being about people. Once learners are taking a course, you'll come back here regularly.
Opening the reports
From a course's details page, click the Reports tab. Company Administrators and the course's Instructors can open it; a Student or Observer who tries is sent back to the course content — they don't have access to other people's data.
On an instructor-led course the page works differently: completion is measured by attendance, not progress. The progress cards are replaced by a tile reading "Attendance, not progress", the Status mix and Needs attention blocks don't appear, the Learners tab is titled Registered learners without the progress columns, and the Overview shows a Session attendance panel with its own Export attendance CSV. The rest of this page describes on-demand and self-paced courses.
The four summary cards
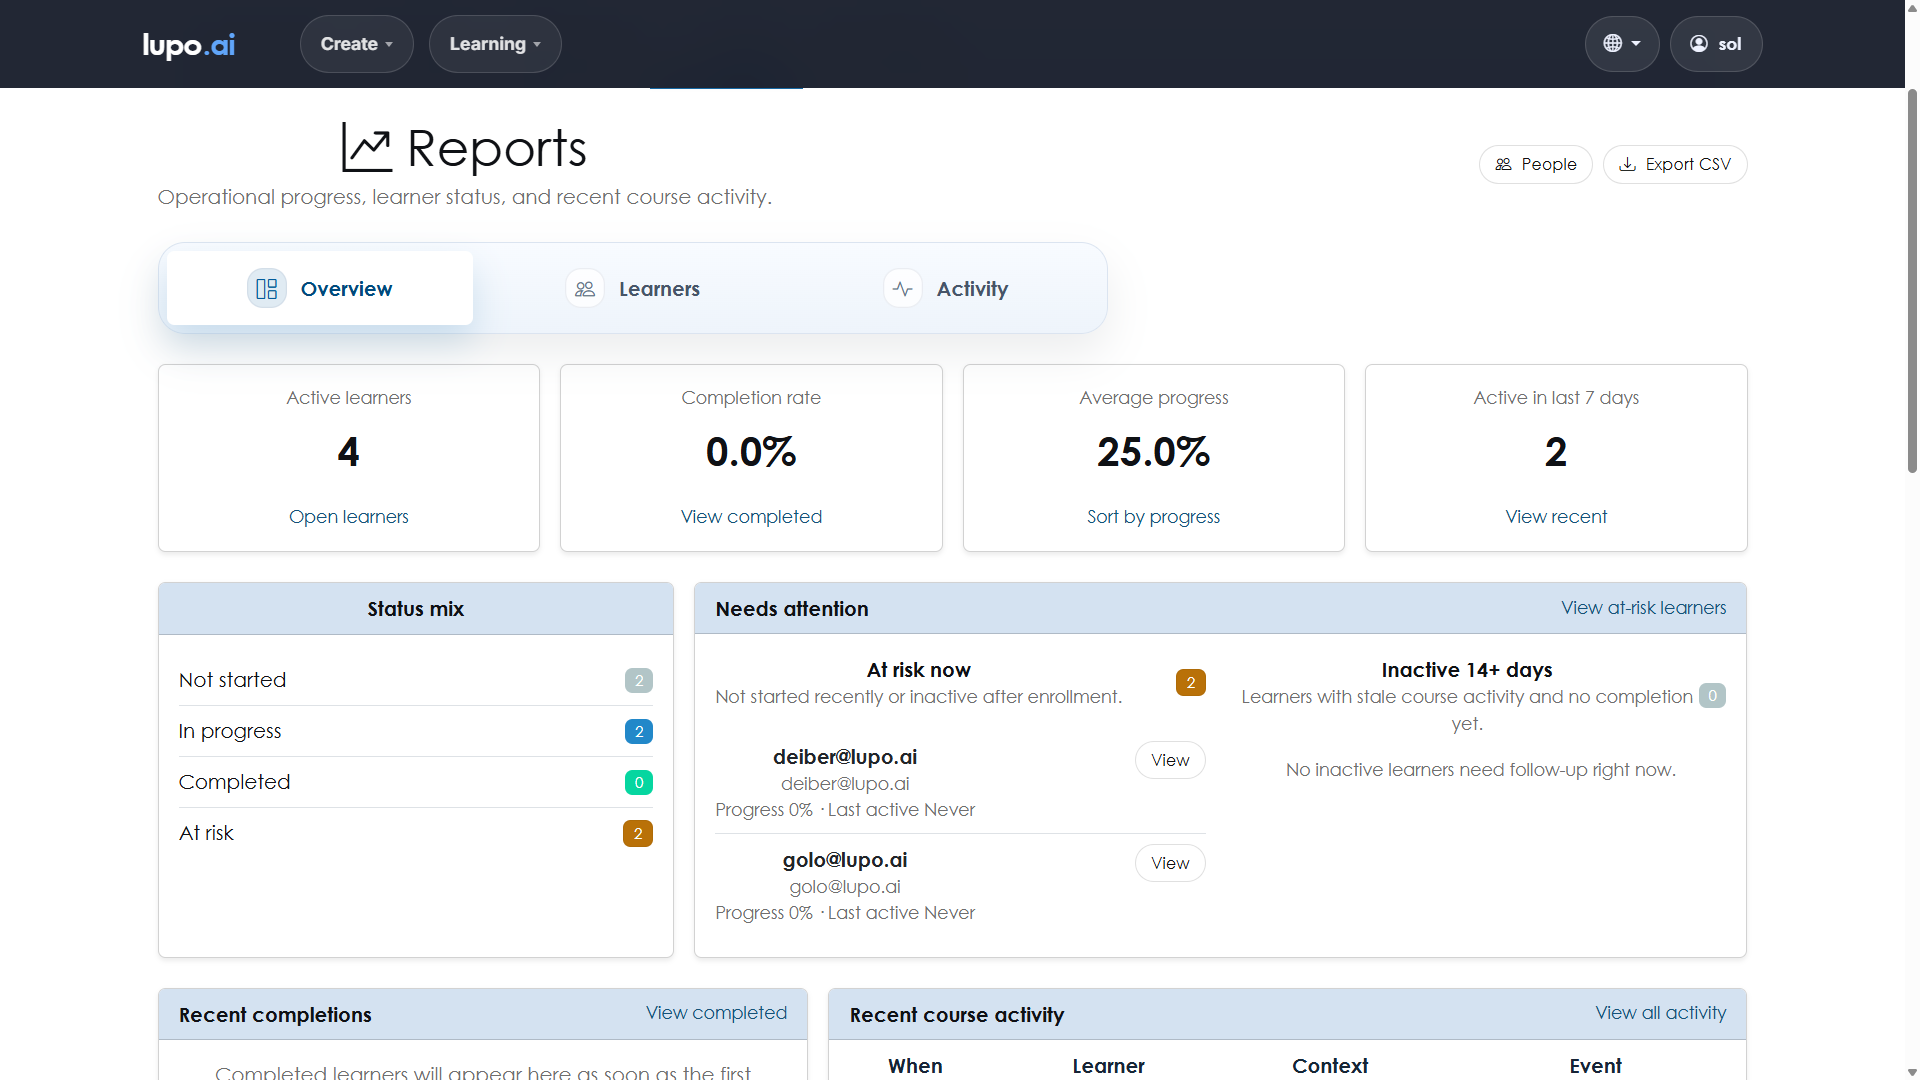
Across the top of the Reports tab you'll see four numbers at a glance:
- Active learners — the number of Students on the roster, finished or not. It's the same headcount the completion rate divides by.
- Completion rate — the percentage of those Students whose status is Completed (they reached 100%, or an instructor or administrator granted the completion).
- Average progress — the mean completion percentage across all enrolled Students.
- Active in last 7 days — how many Students opened the course in the past week. A useful pulse-check for whether a cohort is still engaged.
Observers and Instructors are excluded from all of these numbers — only Student enrollments count — and so is anyone who has been removed from the course.
Overview sub-tab
The Overview tab is your daily dashboard for course health. It surfaces the things most worth looking at without requiring you to dig into individual learner records.
Status mix shows a breakdown of your enrolled Students by where they are: Not started, In progress, Completed, or At risk. A learner is at risk when they haven't finished and either are still at 0% a week after being enrolled, or have gone inactive (see below). A large "Not started" count in a cohort that launched a week ago is a signal to send a nudge; a large "At risk" count means people have stalled. Each count links to the Learners tab filtered to those people.
Needs attention surfaces specific learners so you can act without manually searching the roster. It's divided into two groups: At risk now ("Not started recently or inactive after enrollment.") and Inactive 14+ days ("Learners with stale course activity and no completion yet." — no activity for 14 days, which includes never having opened the course in the 14 days since they were enrolled). Each group shows up to six learners, oldest activity first, with a View button to their individual page.
Recent completions lists the six learners who most recently finished the entire course, with the date; View completed opens the full list on the Learners tab.
Recent course activity shows the five latest course events — completions, video progress, document opens, roster changes. View all activity opens the Activity tab. The panel updates when you reload the page; it isn't a live stream.
Learners sub-tab
The Learners tab is the detailed gradebook for all enrolled Students. Each row is one person, with columns for Enrolled, Progress, Status, Last active, Last event, and Risk. Use the Status, Risk, and Activity state dropdowns at the top to narrow the list, then Apply.
Click Export learner CSV to download the currently filtered list. The file carries each learner's name, email, enrolled date, progress %, status, last accessed and last event dates, completed date, completion source, and an at-risk flag — the format most stakeholders want when they ask for "a completion report."
Click any learner's name or View progress to open their individual page. From there you can see the Activity breakdown — every section with "x of y completed", each activity's type, started and completed dates, and for videos the percentage watched — and the Recent timeline of their events, with the reason recorded on any instructor correction. Corrections are made per activity, each with a required audit note: on a video activity, Mark complete or Reset progress; on a quiz, View attempts and Reset attempts. If a learner's completion was granted by an instructor or administrator rather than earned, the page says so and offers Reverse this completion. There is no single action that resets a learner's whole course.
Activity sub-tab
The Activity tab is the course's audit trail: opens, completions, resets, quiz submissions and roster changes, each as a timestamped row. The page shows the latest 25 events that match your filters; for everything else, click Export activity CSV, which carries every matching event, not only the 25 on screen.
Use the filter controls at the top to narrow by learner, event type, source (Learner activity, Instructor corrections, or Roster audit), activity, or date range. Event types include Opened, Reopened, Progress updated, Completed, Reset, Quiz submitted, Enrollment added, Enrollment removed, and Role changed. This is the "just in case" layer — most of the time you'll skim it, but if a stakeholder asks for evidence that a specific person completed a specific module, the Activity tab (or its export) is where you find it.
Reports and course changes
A few things to keep in mind if you edit a course while learners are progressing:
Adding a required activity grows the denominator, which lowers everyone's completion percentage; removing one raises it. Activities and sections marked optional don't count either way. Renaming an activity updates the name everywhere, including in historical events. Removing someone from the course takes them off the roster and takes their progress events out of the Activity tab — only the roster entry ("Removed … from course") remains — so export the learner and activity CSVs first if you need their history.
For tight cohort analytics, freeze the course structure before the cohort starts and don't edit it until they're done. For rolling-enrollment courses, accept that the numbers will shift as content and enrollment change over time.
Where to go next
- How Progress Is Tracked — how the underlying completion data is computed.
- Roles in a Course — who can access reports and why Observers are excluded.
- Enrolling People in a Course — the source of the roster.